Overview
Insights is the analysis layer of a Trickest Solution. It consolidates results from workflow runs into fast, searchable datasets so you can track change over time, filter precisely, and focus on what matters. Insights is built on three main pillars:- Unified data — module outputs are normalized into consistent, queryable tables.
- Real‑time updates — new results appear as runs complete.
- History-aware views — statuses highlight what changed between runs (e.g., new, resurfaced, removed, unchanged).
How Insights Works
1
Runs produce artifacts
Each node outputs structured tables (per module).
2
Normalization & merge
The platform aligns fields (e.g., hosts, IPs, ports, technologies) into datasets.
3
Index & filter
Datasets are indexed for low‑latency querying from the Insights UI.
4
Change & history tracking
Deltas between runs determine the status shown on each row.
Typical datasets include Subdomains, IP Addresses, Open Ports, Network Services, and Web Servers. Actual datasets depend on the modules present in your workflow.
Navigation
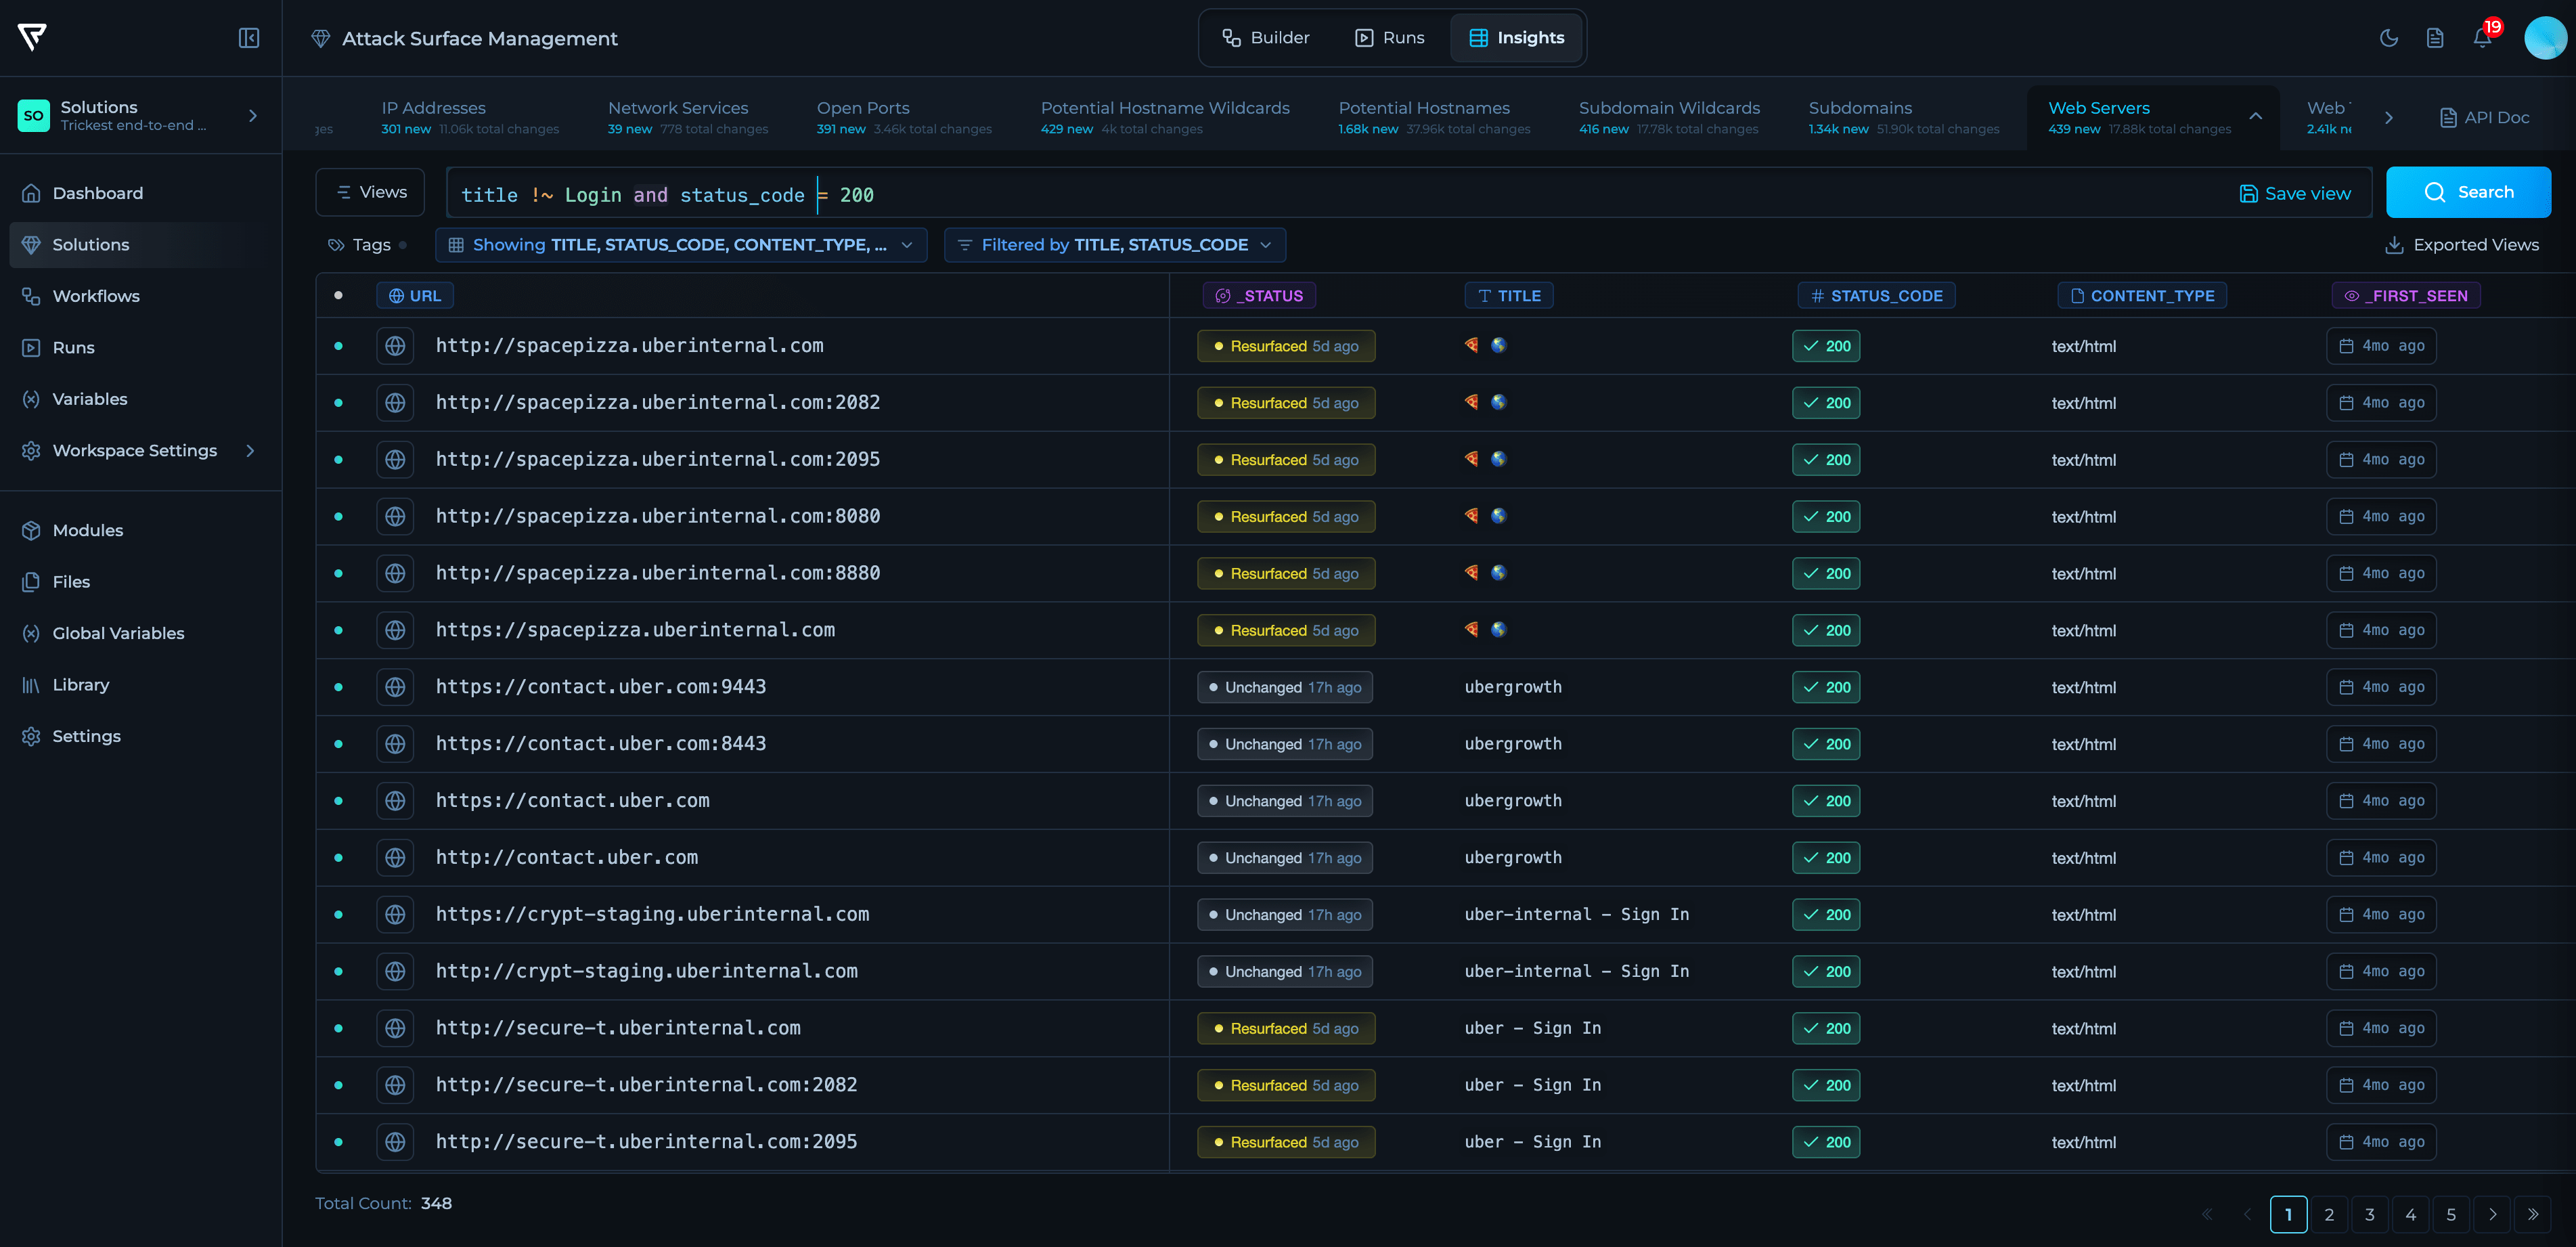
Dataset bar
Switch between datasets attached to the Solution. Counters show recent changes at a glance so you can prioritize where to start.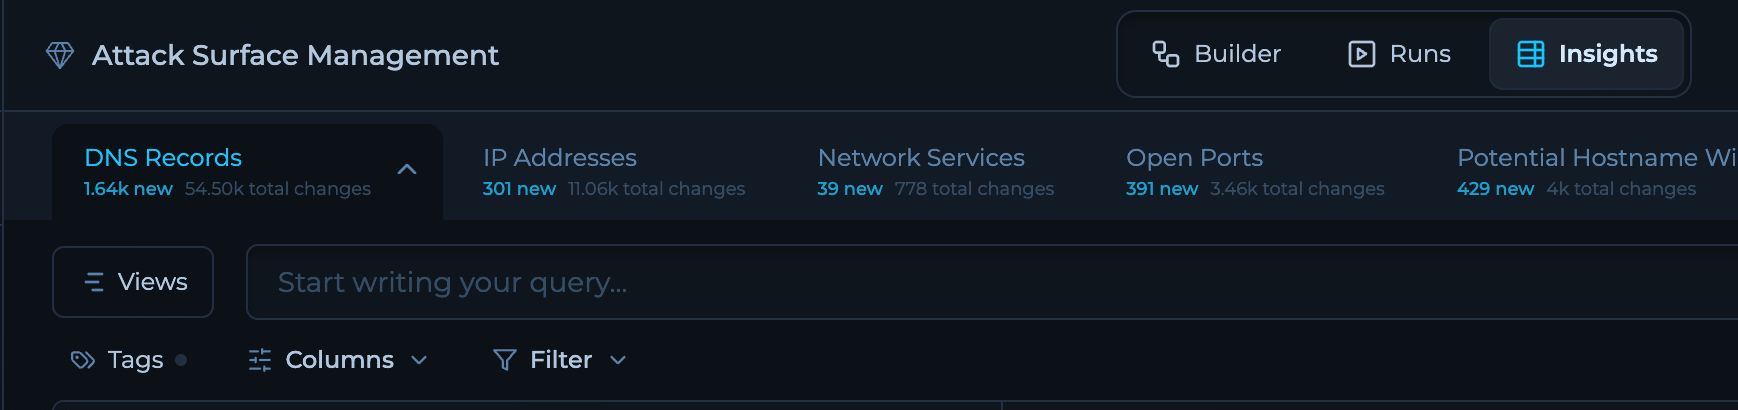
Query bar
Type filters to narrow results. Autocomplete and inline validation help you compose precise conditions without memorizing field names.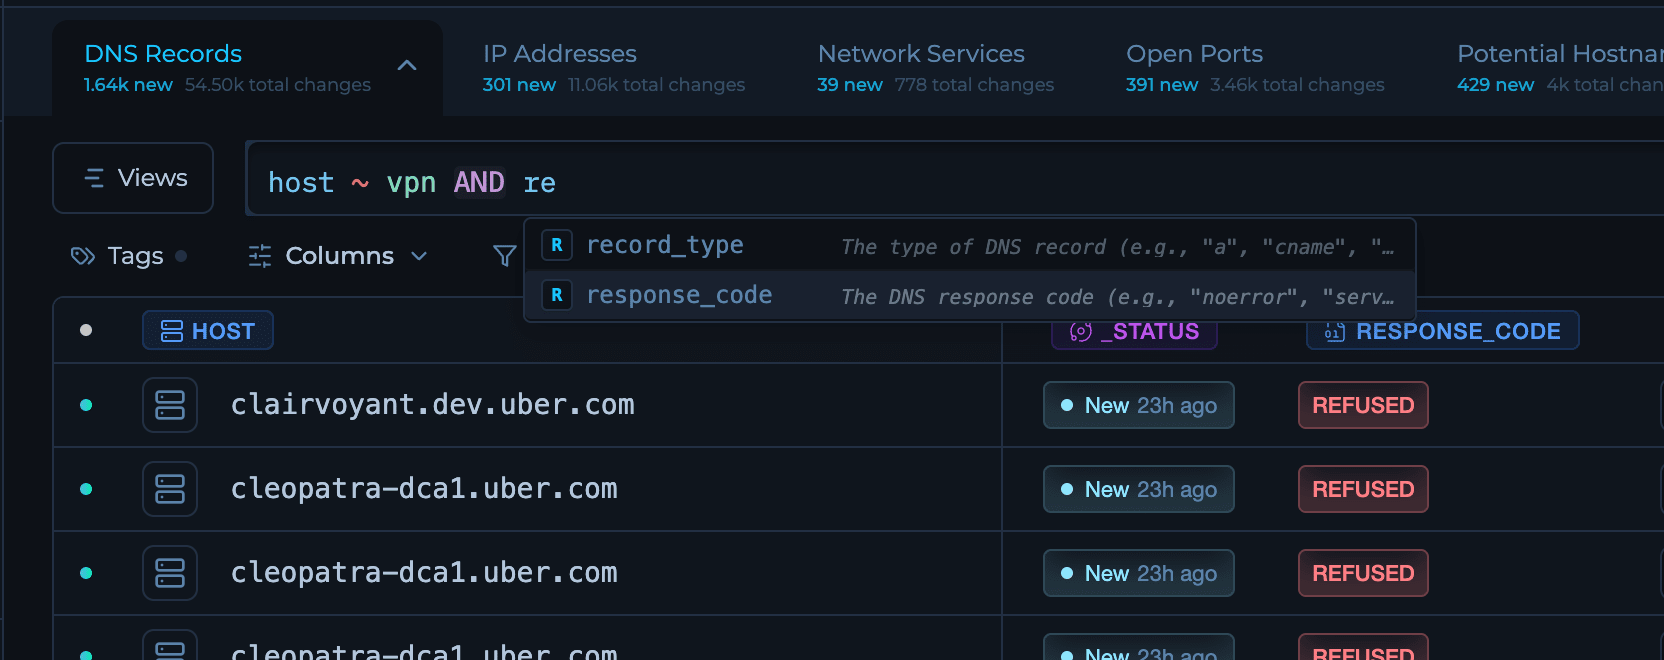
Views
Select fields, reorder columns, define sorting, and save the layout for reuse. Views help teams standardize triage setups.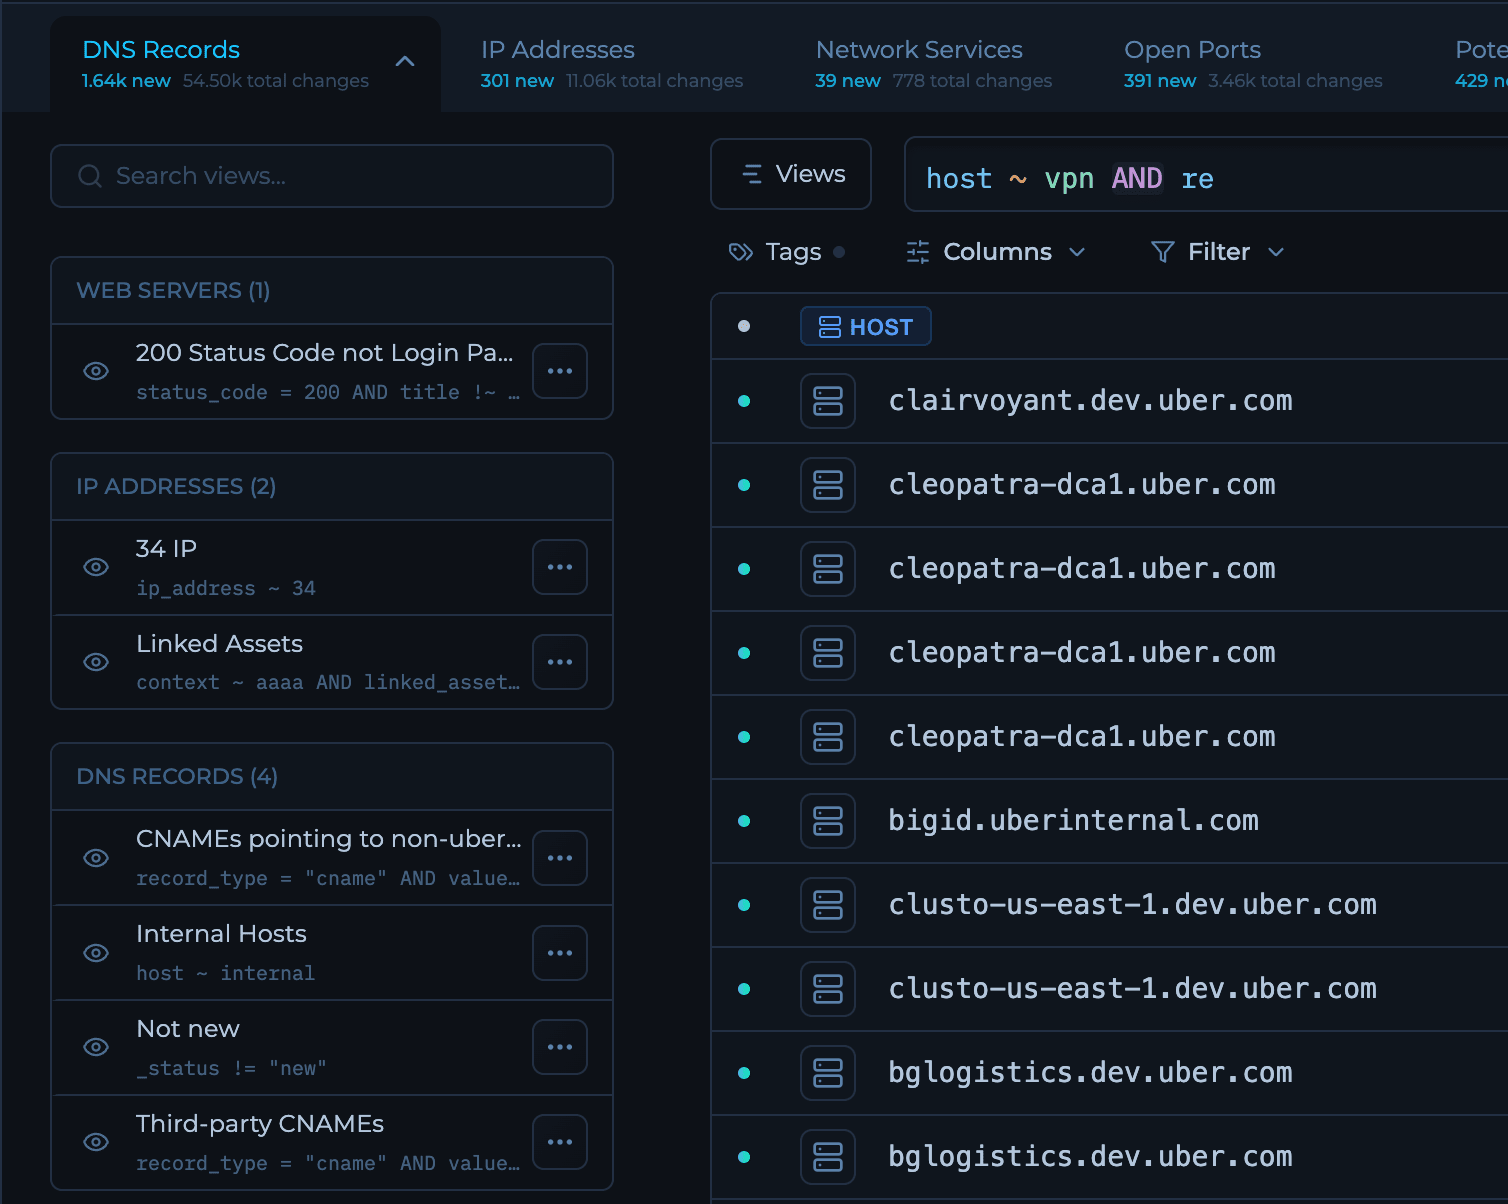
Creating a View
1
Select a dataset
Choose the dataset you want to create a view for from the dataset bar.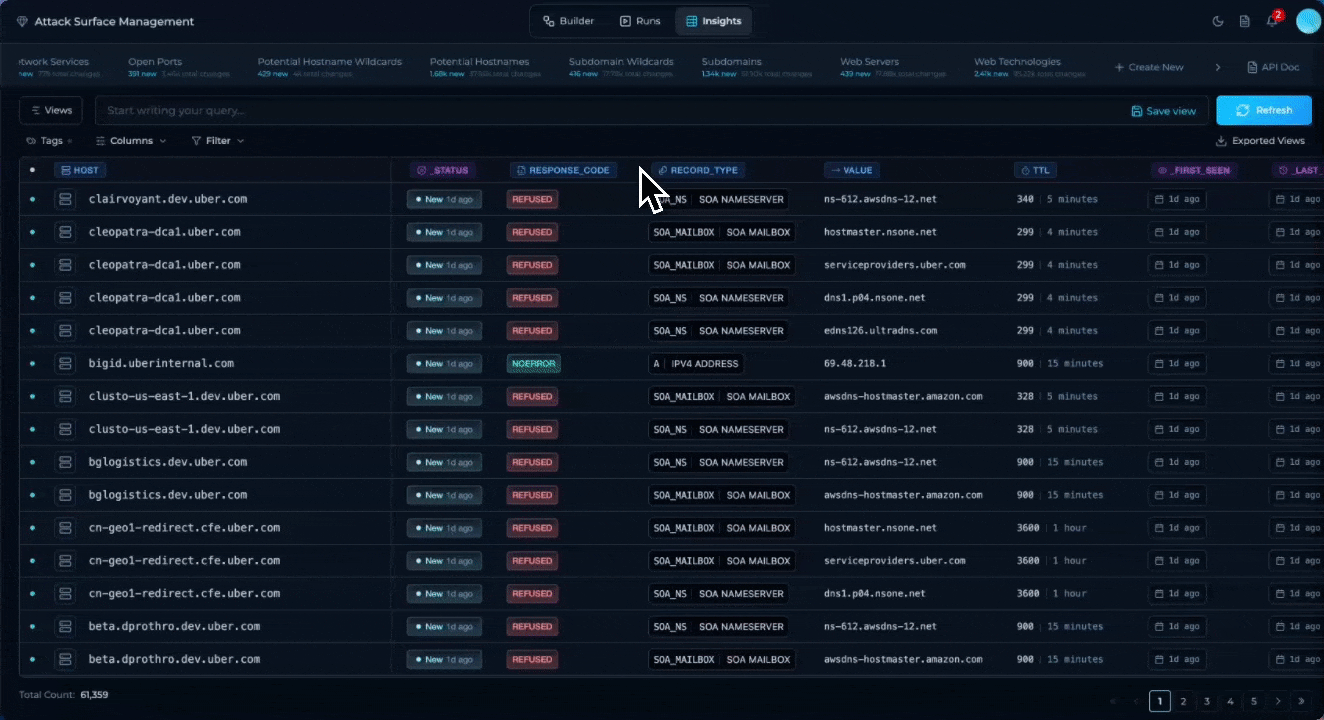
2
Customize columns
Click on the column selector to add, remove, or reorder fields. Drag columns to adjust their position in the table.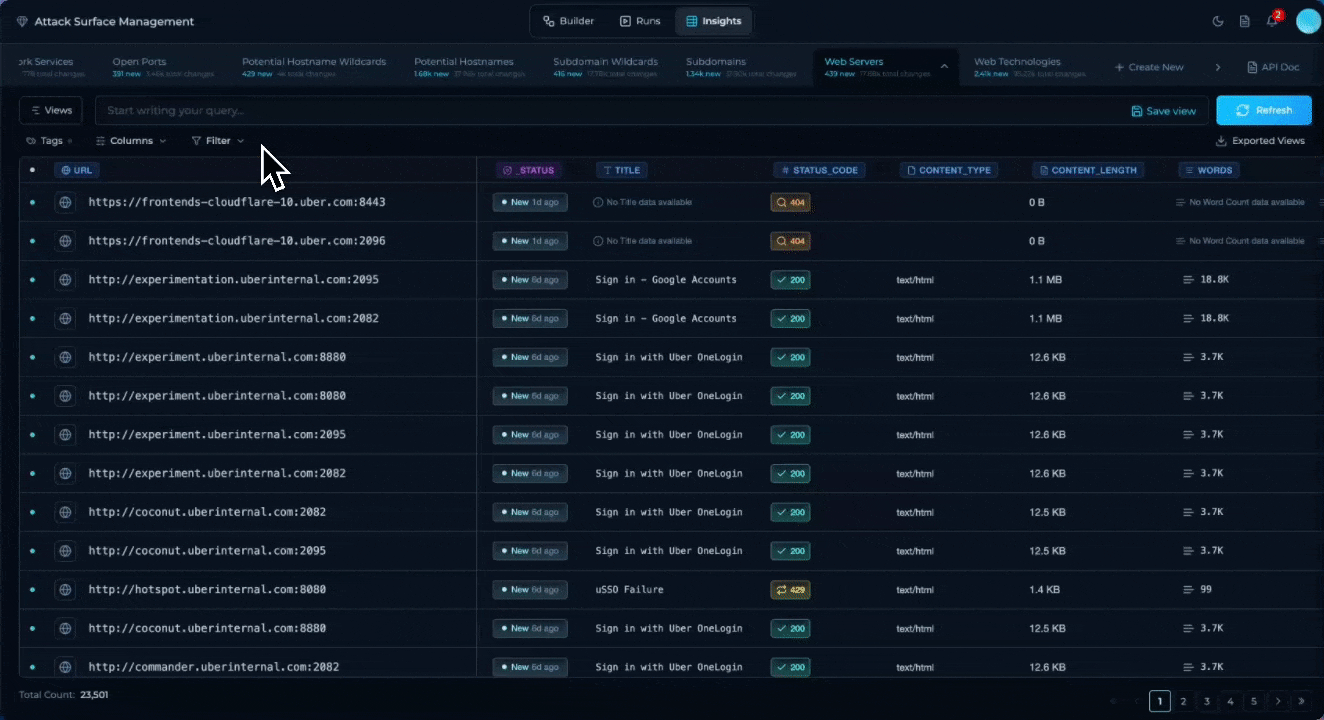
3
Apply filters and sorting
Use the query bar to define filters, then configure sorting by clicking on column headers.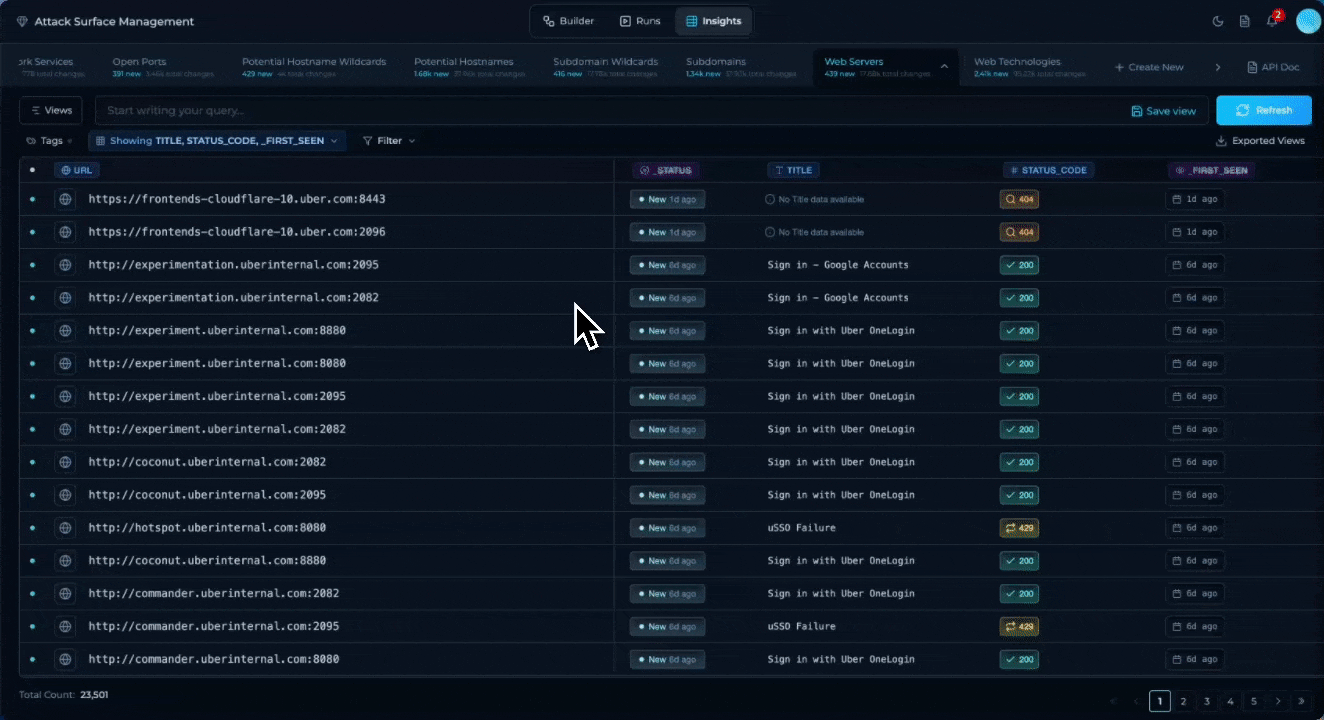
4
Save the view
Click the Save View button, provide a descriptive name, and confirm. The view becomes available to all team members with access to the Solution.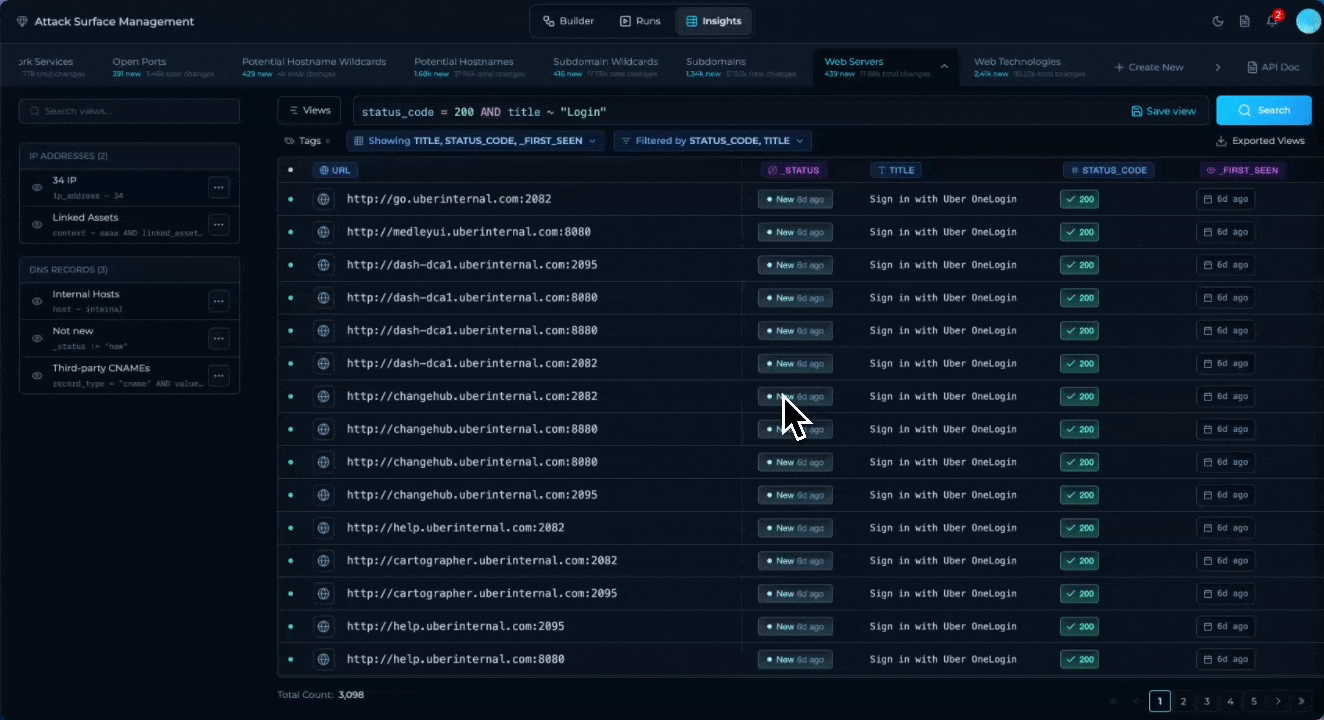
Row details
Click onView button when hovering over row to open more details, go through the history of changes or collaborate with other team members.
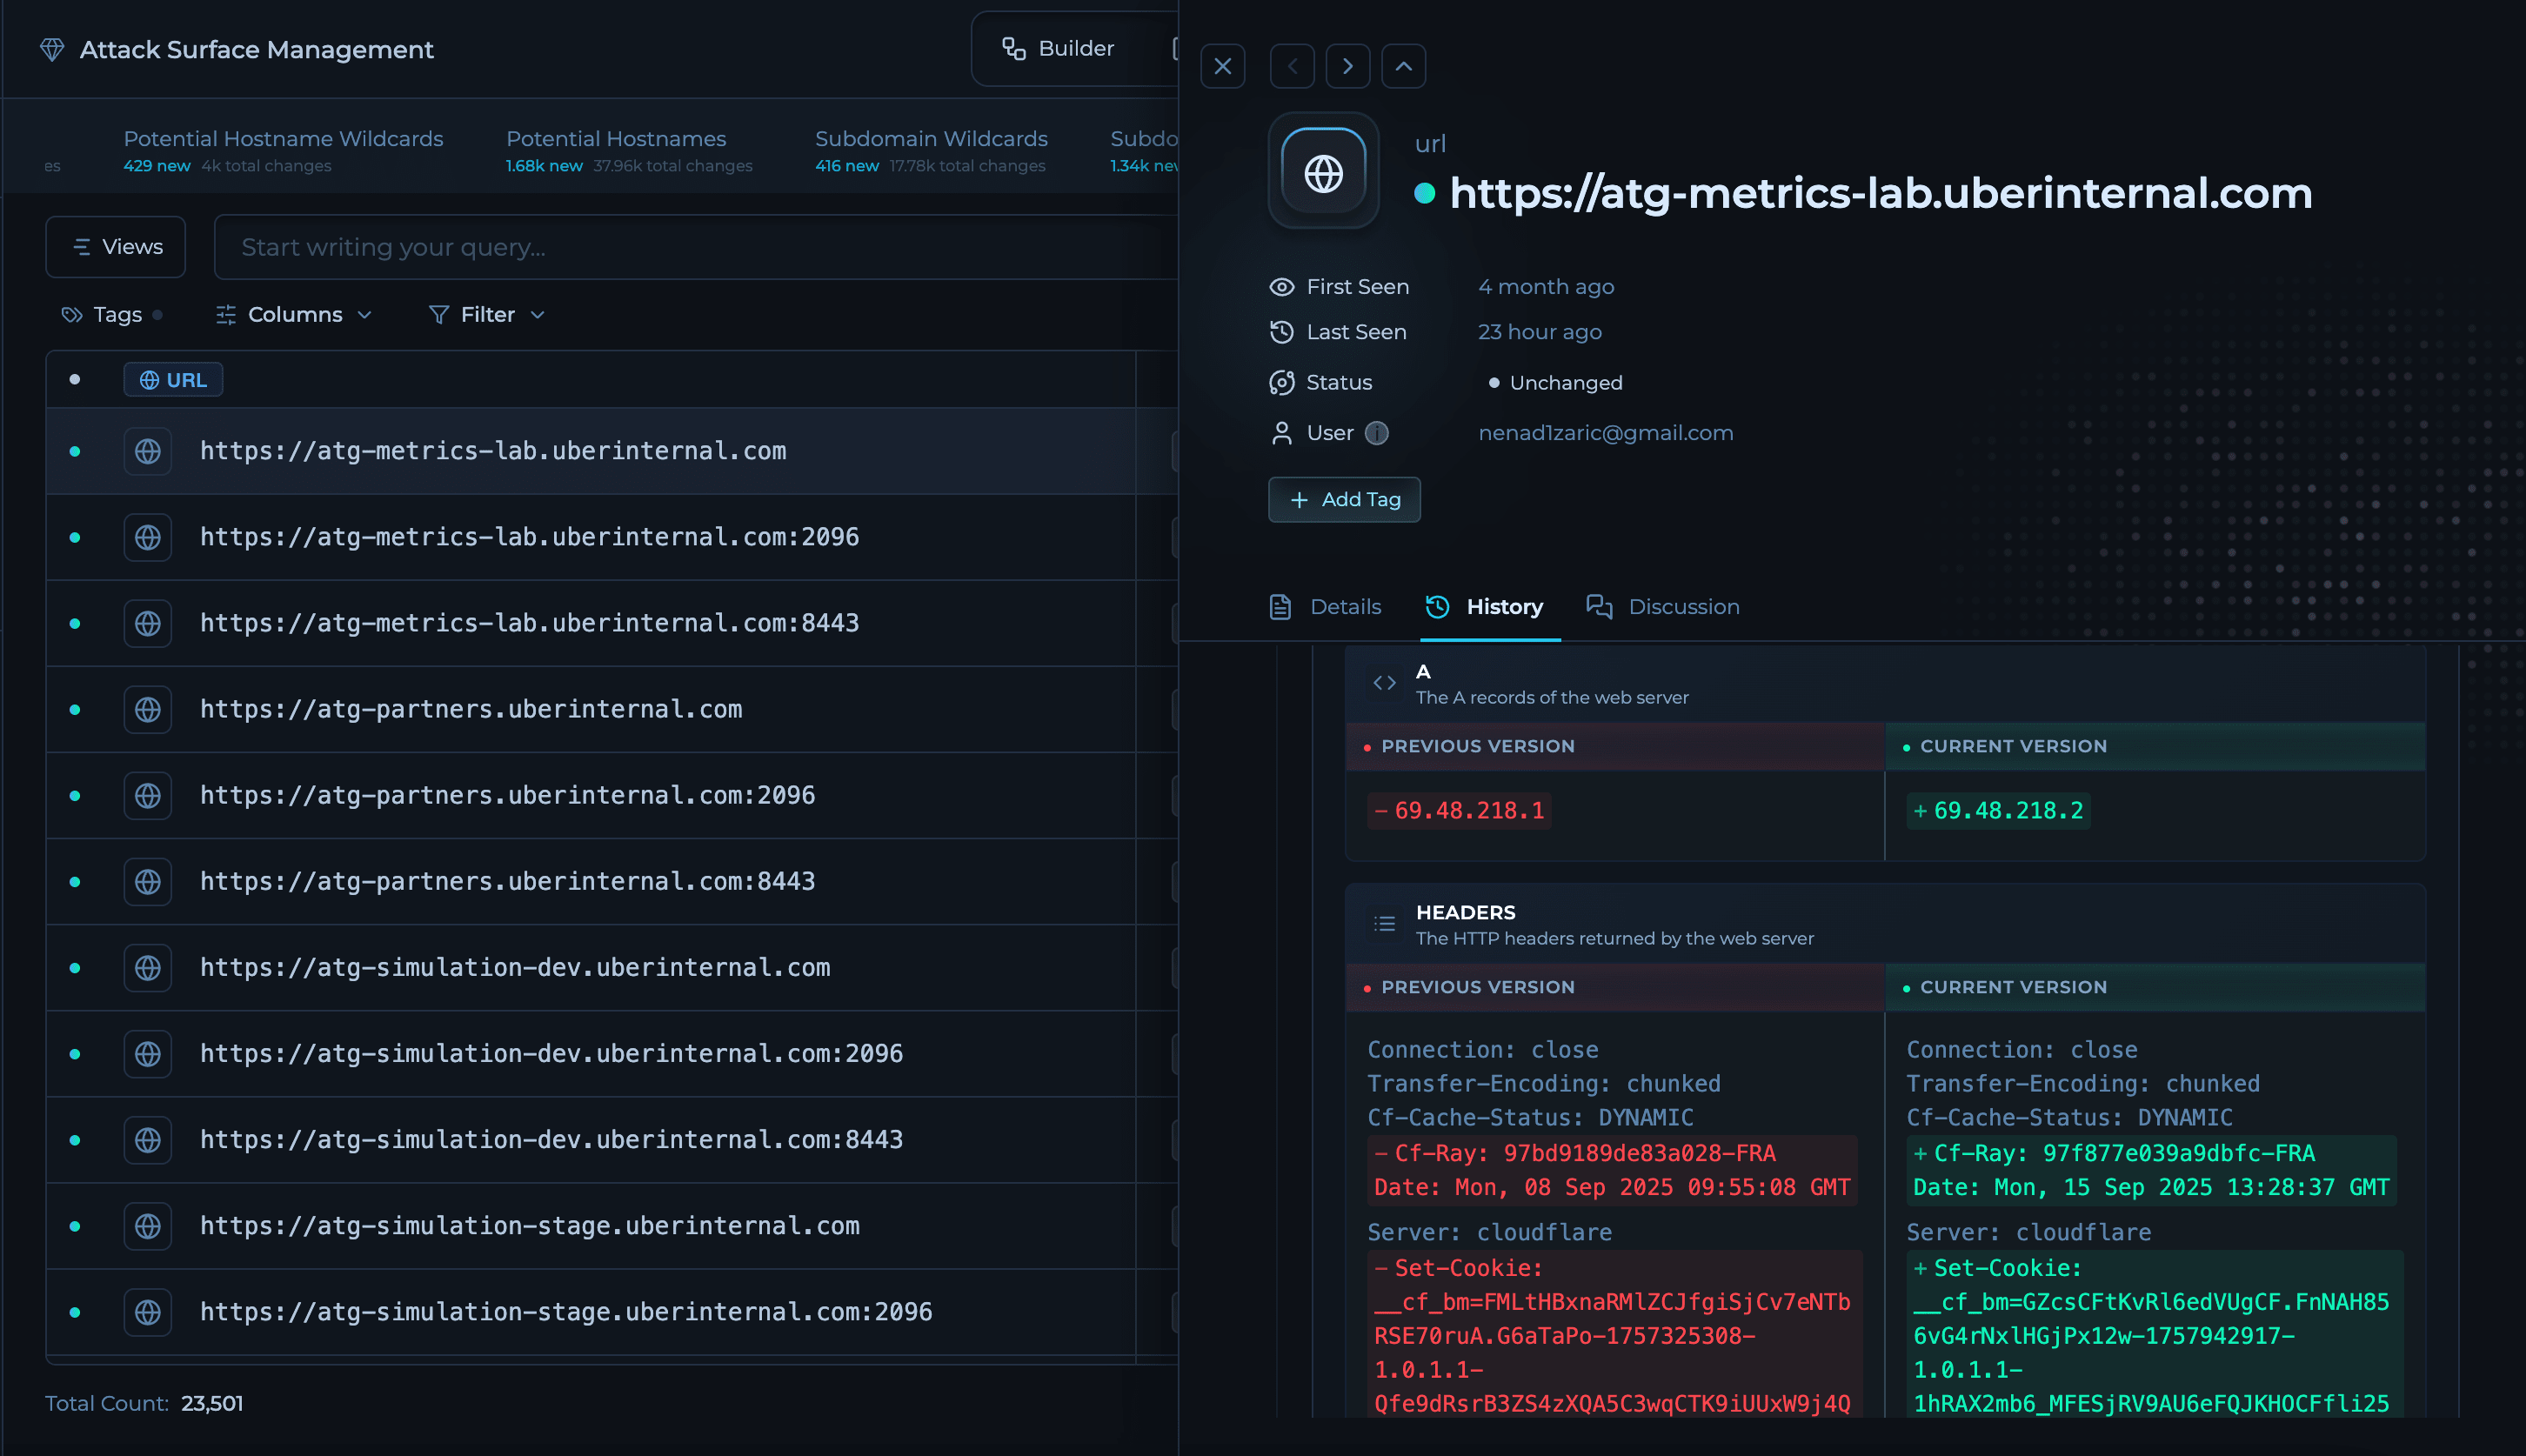
Statuses & Change Tracking
Insights automatically tracks changes across workflow runs within a defined timeframe, assigning each record a status based on its appearance pattern. Understanding these statuses helps you prioritize investigation and focus on what matters most.All statuses are evaluated within a specific timeframe and are based on the unique keys (default fields) defined in your dataset schema.
Status Definitions
New
First appearance of a unique record within the tracking timeframe.The combination of key fields has not been observed before in this timeframe. Could represent genuinely new discoveries or items that existed outside the timeframe window.Example: Subdomain
api-v2.example.com appears for the first time in your monitoring.Actions:- Investigate new assets or vulnerabilities immediately
- Track expansion of attack surface
- Verify if discovery aligns with expected infrastructure changes
Resurfaced
Record that was previously present, disappeared, and has now reappeared.The item existed in earlier runs, was absent from at least one subsequent run, and has been detected again in the latest run.Example: Open port
443 on 10.0.1.50 disappeared for 3 days and is now back.Actions:- Investigate why services went offline and returned
- Track intermittent vulnerabilities or misconfigurations
- Identify infrastructure that cycles on/off
Missing
Record that was present but is absent in the most recent run(s).The item was consistently detected but has recently stopped appearing. The absence is relatively recent (shorter duration than “Removed”).Example: Web server responded yesterday but not responding today.Actions:
- Check for transient network or DNS issues
- Investigate recent infrastructure changes
- Verify if assets were intentionally taken offline
Removed
Record absent for an extended period after being previously detected.The item was present but has been missing for a significant duration. More likely to indicate permanent decommissioning than “Missing” status.Example: API endpoint hasn’t responded in over a week after months of detection.Actions:
- Confirm intentional decommissioning of assets
- Archive records that are no longer relevant
- Audit infrastructure reduction for compliance
Unchanged
Record consistently present across multiple runs within the timeframe.The unique key combination appears in consecutive runs, representing stable, persistent assets or findings.Example: Production web server detected in every scan for the past month.Actions:
- Establish baseline of stable infrastructure
- Filter out to focus on changes only
- Monitor for unexpected deviations
Working with Insights via API
Every Solution includes an API Docs panel with ready‑to‑use requests (curl, Python, JavaScript) that are scoped to your workspace and the selected dataset. You can:- List datasets attached to a Solution.
- Apply the same filters used in the UI to retrieve records.
- Page through results for downstream systems and reporting.
Open a Solution → API Docs to copy examples with the correct base URL and identifiers.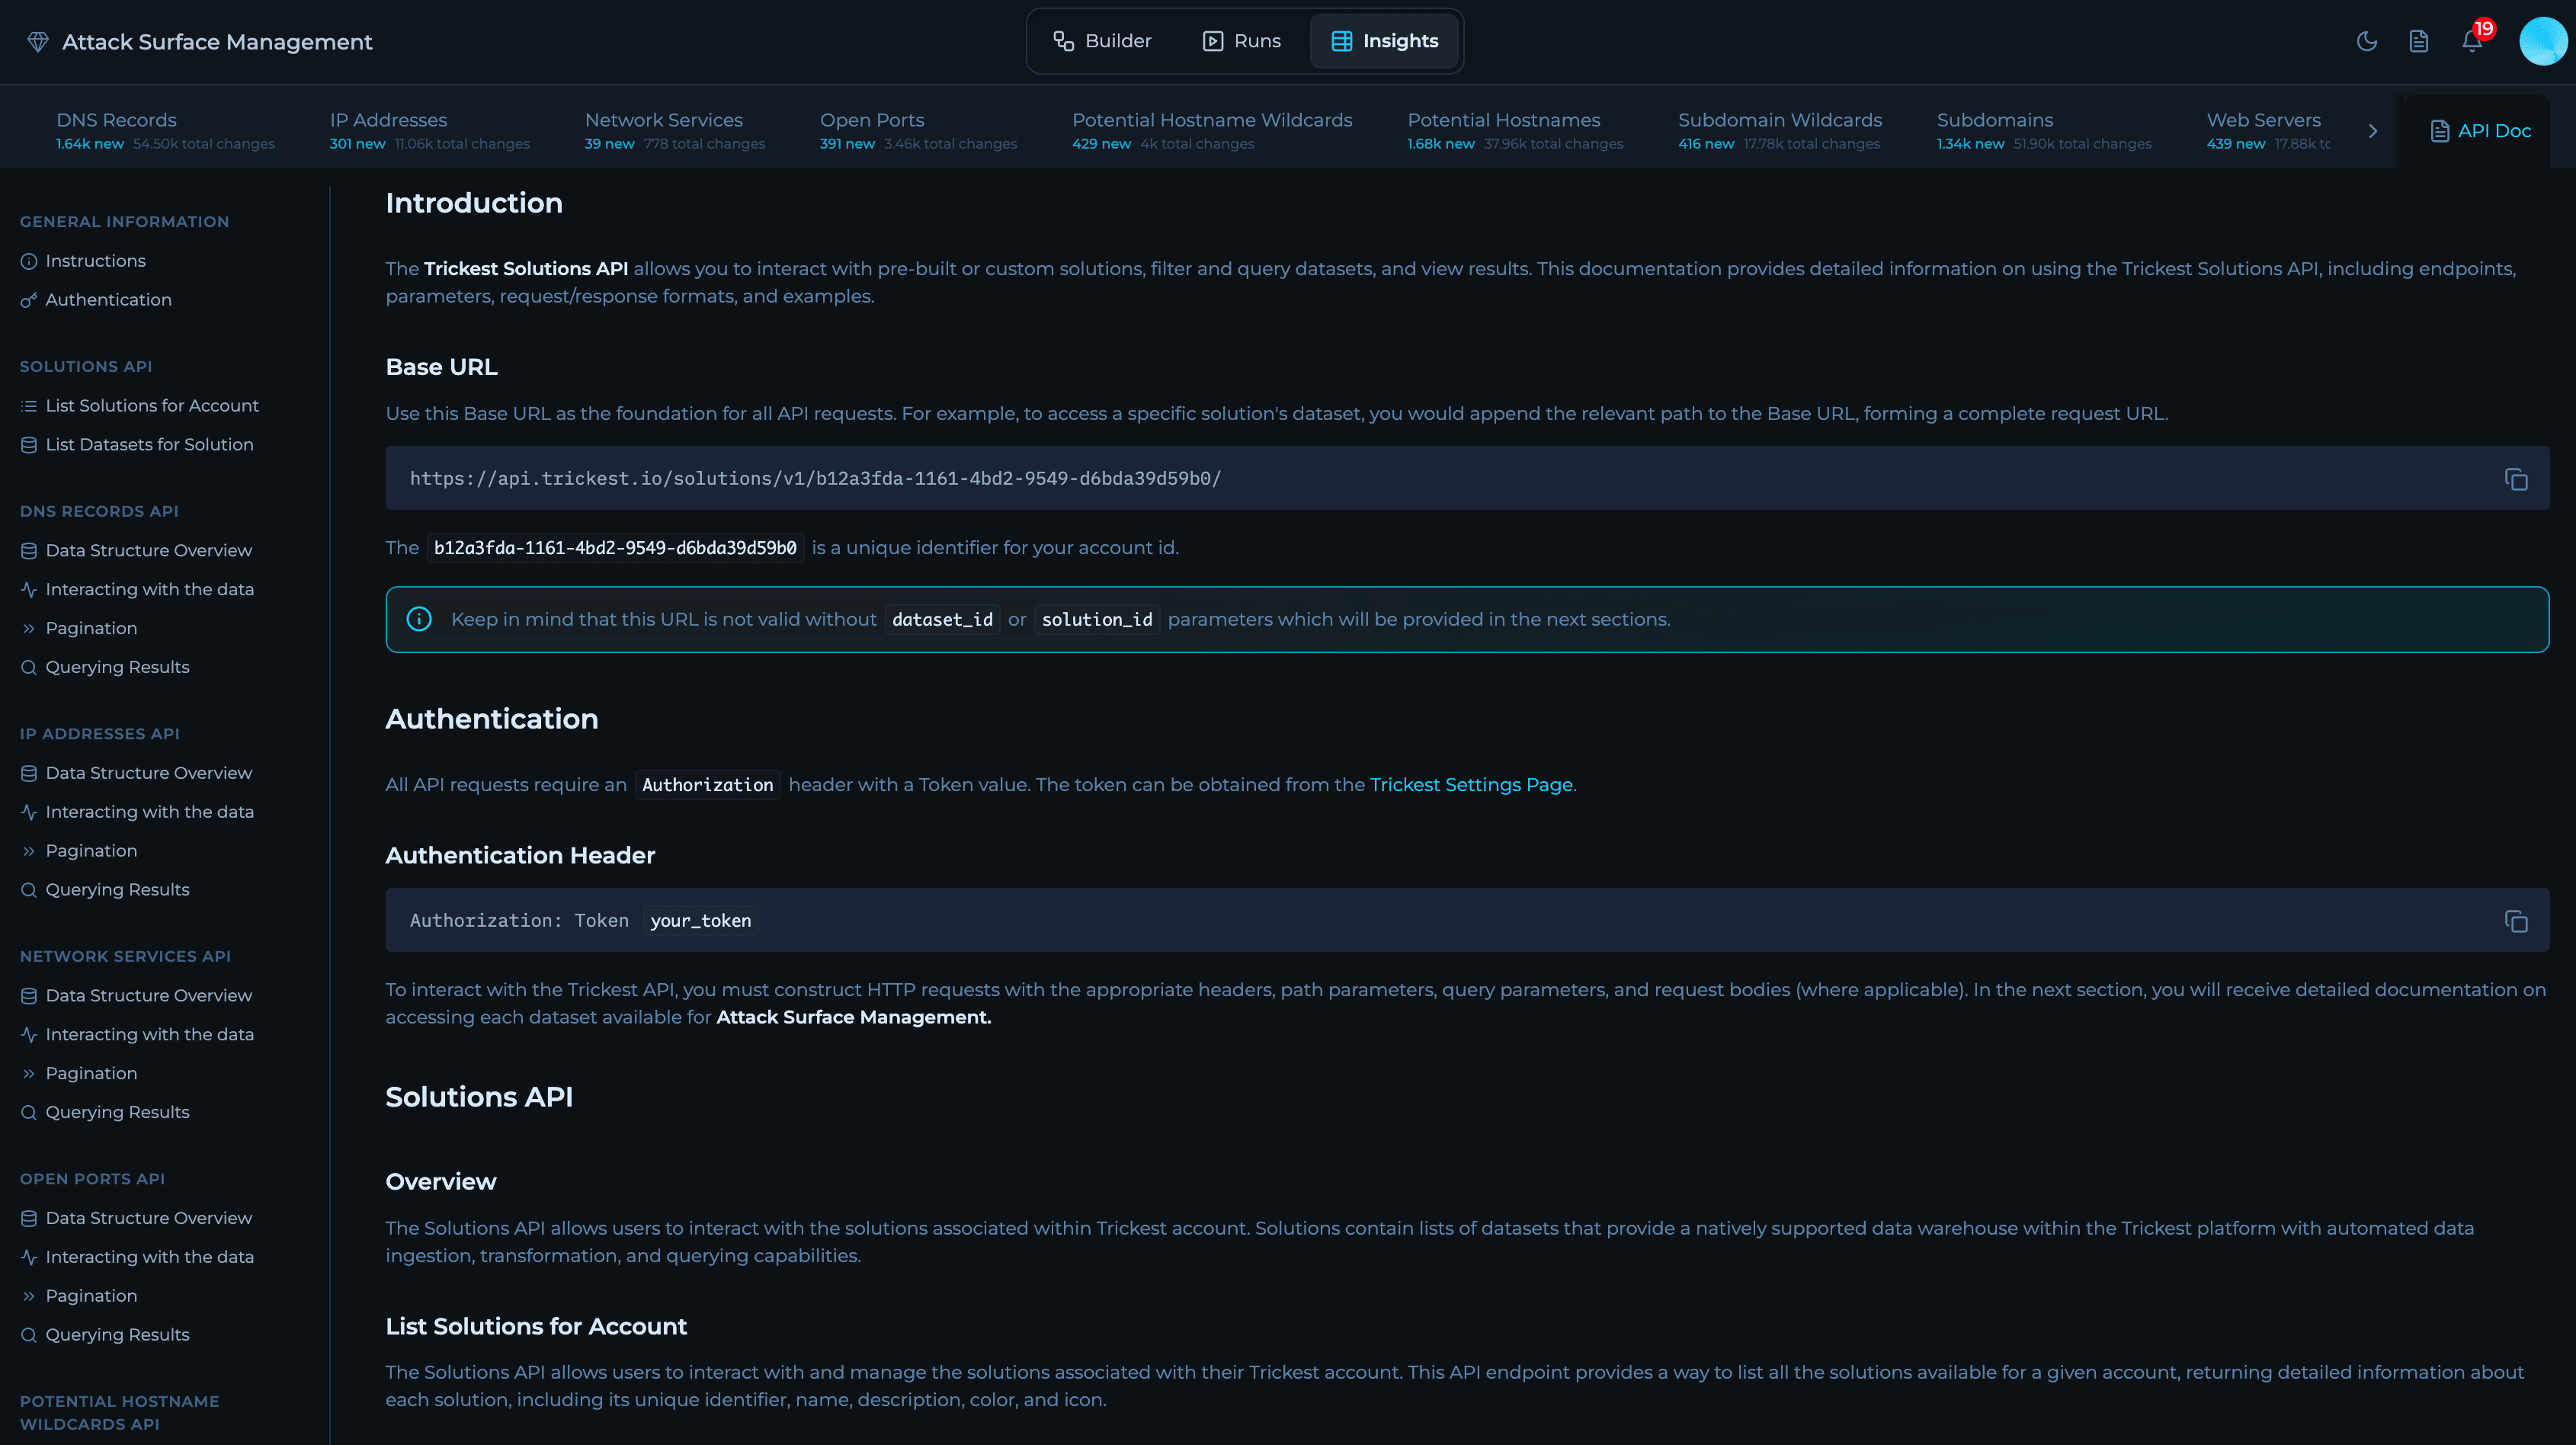
Troubleshooting
- Zero results — often means filters are too restrictive. It can also mean data isn’t ingested yet (run still in progress) or the workflow output isn’t connected to the target dataset. Remove conditions one by one, confirm the correct dataset is selected, check run completion, and verify node→dataset connections.
- Broad to narrow — begin with minimal filters, then add specificity.
- Pattern matching — if a field supports it, use concise patterns for performance.